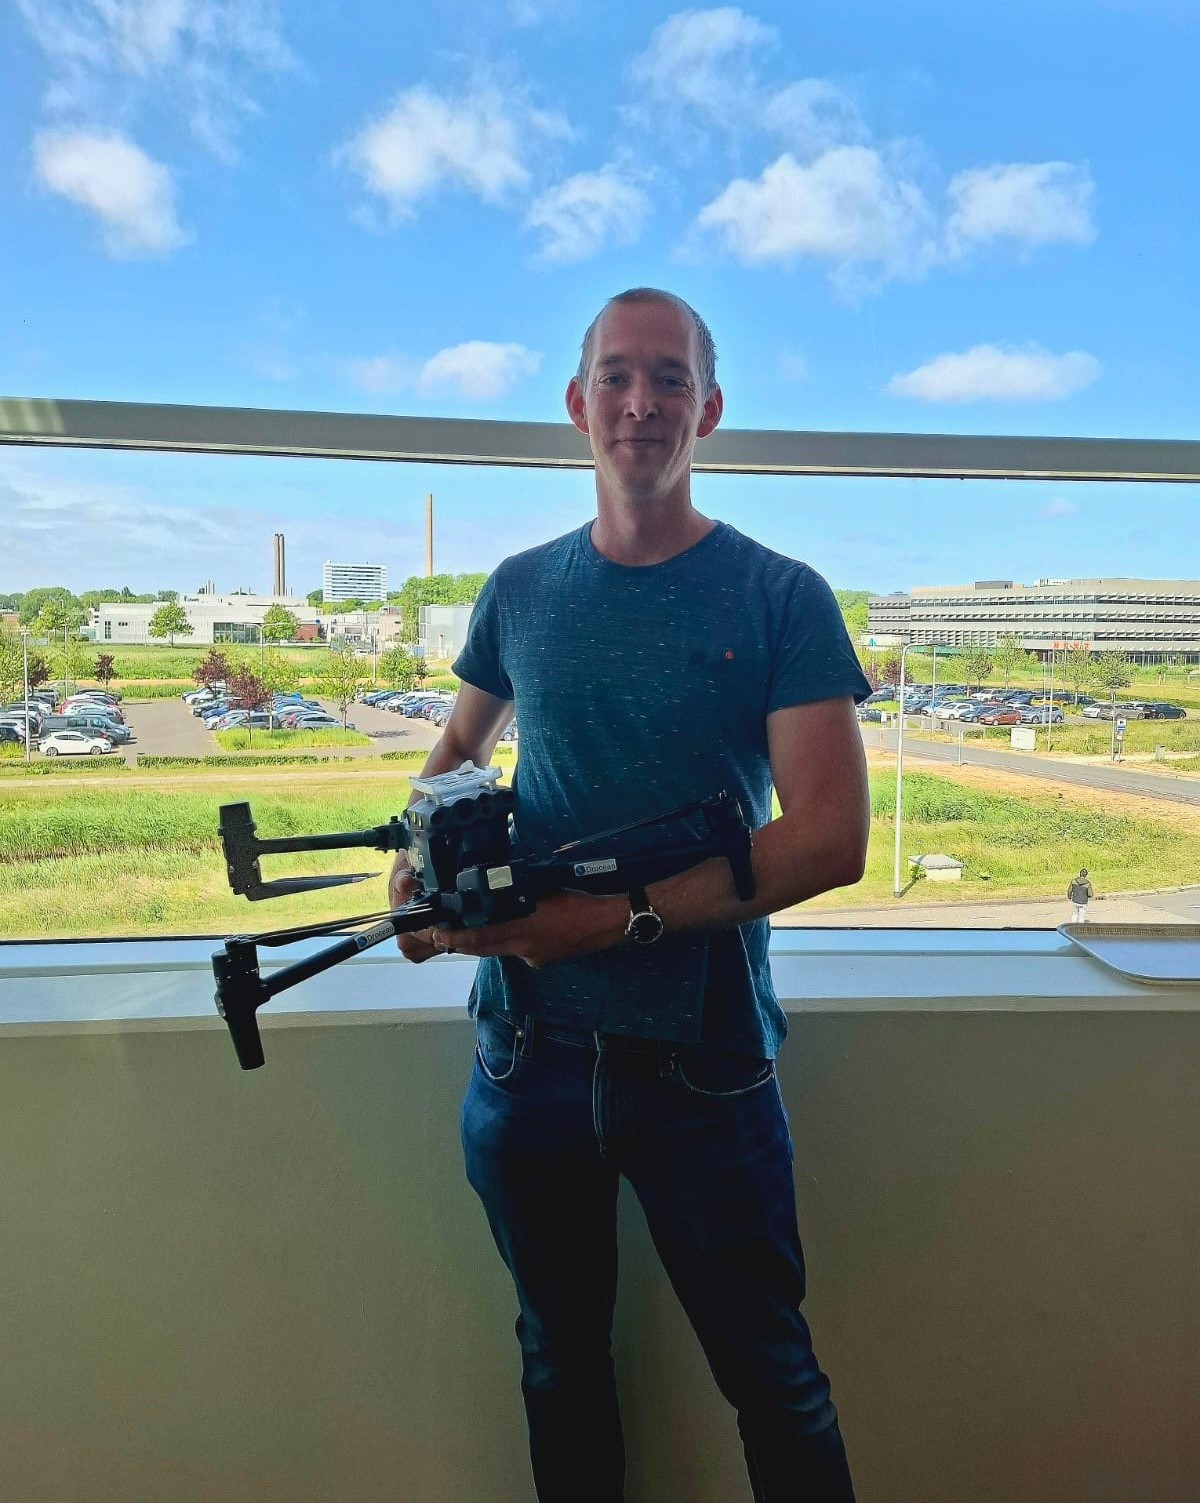
Reliable coverage is not only important on land, but also at sea. Certain parts of the Dutch coastal waters are not covered. Therefore, startup Drocean aims to create a complete and detailed 5G/4G coverage map of the North Sea to foster within the Dutch maritime sector.
Duration
January – December 2025
Partners (TU Delft)
Do IoT Fieldlab, TU Delft, Unmanned Valley
Partners (other)
Tackling offshore challenges
This project aims to tackle several challenges, such as poor network reception and network range from coastal areas to international waters and legal restrictions for drone operations (BVLOS). This aligns with Drocean’s expertise as a company specializing in offshore drone operations.

Added value
Documenting coverage areas and connectivity capabilities are essential, as there is a growing demand for offshore wireless applications. For example, to inspect wind farms with drones or to communicate with wave energy converters. With this project, Drocean is laying the foundation for digital innovation at sea. The collected data can help other companies develop solutions that require 5G.
Many smaller initiatives have conducted similar experiments for own use, only covering parts of the waters, resulting in scattered data and expertise. Drocean strives to realize a complete overview of the offshore coverage.
5G
The drones used for this project usually operate on radio signals only. However, to determine which areas at sea have sufficient coverage to transmit media, such as video, wave measurements or other large files, the use of 5G is essential. Drocean expects to gain insight into communication possibilities and achieve advantages in terms of connectivity, bandwidth, latency and reliability by using 5G as a wireless communication network during the experiment.
Gradual approach
The approach will be phased in several steps. First, prototypes of the drone measurement system will be evaluated and tested. Then, the data collection will start using drones equipped with a 5G modem, measuring signal strength from different altitudes. This will eventually lead to 3D heatmaps, visualising coverage variations.
